Graphic
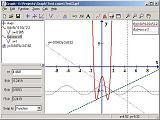
 This program is for drawing graphs of mathematical functions in a coordinate system. Graphs may be added with different color and line styles. Both standard functions, parameter functions and polar functions are supported. It is possible to evaluate a function at an entered point or tracing the function with the mouse. It is possible to add shadings to functions, and series of points to the coordinate system. Trendlines may be added to point series. It is possible to save the coordinate system and everything on it as an image file. It is also possible to copy an image into another program. Text labels may be placed anywhere in the coordinate system.
Within these limits, it offers most of the features any mathematically minded computer user could ask for. Standard, parameter, and polar functions are supported. It includes a huge number of predefined functions, but new ones can be added. Tangents, normals, and derivatives can be drawn. Users can add relations and set constraints. The program can calculate the length or area of a selected function, or determine its first and second derivatives. From a cosmetic point of view, users can freely adjust axes, figure width and color, and shading. We would like to see the addition of three-dimensional graph support, which would be useful for displaying complex functions. However, on the whole, this is an elegant and well-designed tool for computer users who need to turn abstract equations or data points into their graphical equivalents.
Version 4.3 adds calculation of the area under parametric functions


